The fantasy baseball community loves their advanced stats. Like the new bat tracking data — with bat speed, attack angle and fast swing rate — they provide inputs to the real-life and fantasy outputs that matter. That said, it’s easy for our heads to spin when examining all the advanced stats available on FanGraphs, Baseball Savant and more.
With so many advanced stats available for fantasy baseball, it can be overwhelming for fantasy managers. I still recall when I heard about BABIP (batting average on balls in play), wOBA (weighted on-base average) and barrel rate, which led to more wonderings about the acronym or phrase. Thankfully, the sites that create these advanced stats tend to have definitions about what goes into that metric to help us digest them.
[Join or create a Yahoo Fantasy Baseball league for the 2026 MLB season]
We’ll touch on a few categories for advanced stats in fantasy baseball to hopefully help new and seasoned fantasy managers. The goal of this article is to highlight the common and valuable advanced stats for hitters and pitchers to provide a starting point for beginners and a path to diving deeper into a player’s profile, given the bevy of advanced metrics for fantasy baseball purposes. Before we dive in, it’s important to compare these advanced stats with the league and player’s career norms to help provide a baseline of how much these matter.
Plate Discipline for Hitters
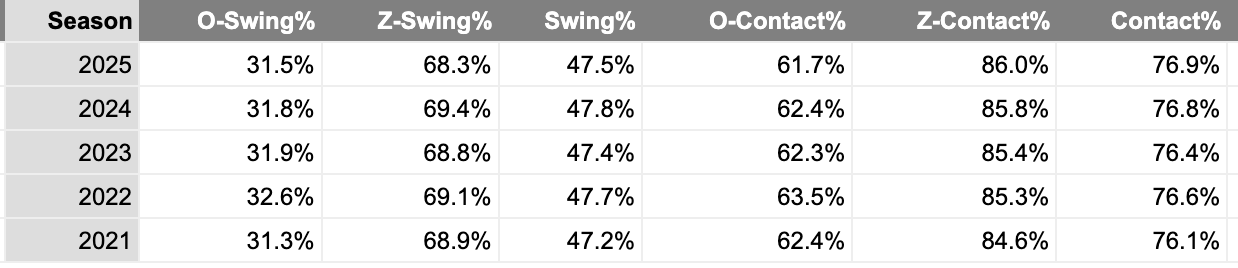
We want to go beyond walks and strikeouts for hitters to examine their plate discipline. It might seem a bit granular, but we can examine swing and contact rates, especially whether they’re inside or outside the zone. The swing rates matter because we can identify whether hitters tend to chase pitches outside the zone, which can lead to higher swinging-strike rates and eventually strikeouts. It’s also helpful to analyze the zone and overall swing rates because they show us whether a player could be patient or aggressive at the plate.
The visual below shows the league averages across the primary plate discipline metrics. When we see O (outside) and Z (zone), they refer to swings and contact rates inside or outside of the zone.
These swing rate metrics have a mixture of people charting the data and Statcast cameras throughout the baseball stadium, depending on the data source. Like any advanced stat, one doesn’t hold weight over another, and they paint a picture for a hitter’s profile together. For instance, a hitter might be patient with low swing rates and doesn’t chase, yet they struggle to make contact. Sometimes we see patient hitters who don’t chase with lower zone and overall contact rates. If that’s the case, we want them to hit the ball hard and in the air. Theoretically, if a hitter makes a high amount of contact, it should provide a higher floor for them, though the contact quality matters.
Some hitters who don’t chase often, yet make league-average contact while hitting the ball hard, include Will Smith, Juan Soto, Trent Grisham, Seiya Suzuki and Wyatt Langford. Ideally, we want hitters who fit those molds instead of hitters with high contact rates who struggle to hit the ball hard. Examples of those high-contact hitters with low exit velocities include Luis Arráez, Steven Kwan and Jacob Wilson. Though those hitters can provide high batting averages, they tend to be one-category contributors, or maybe two, if they hit atop the lineup.
Statcast Data for Hitters
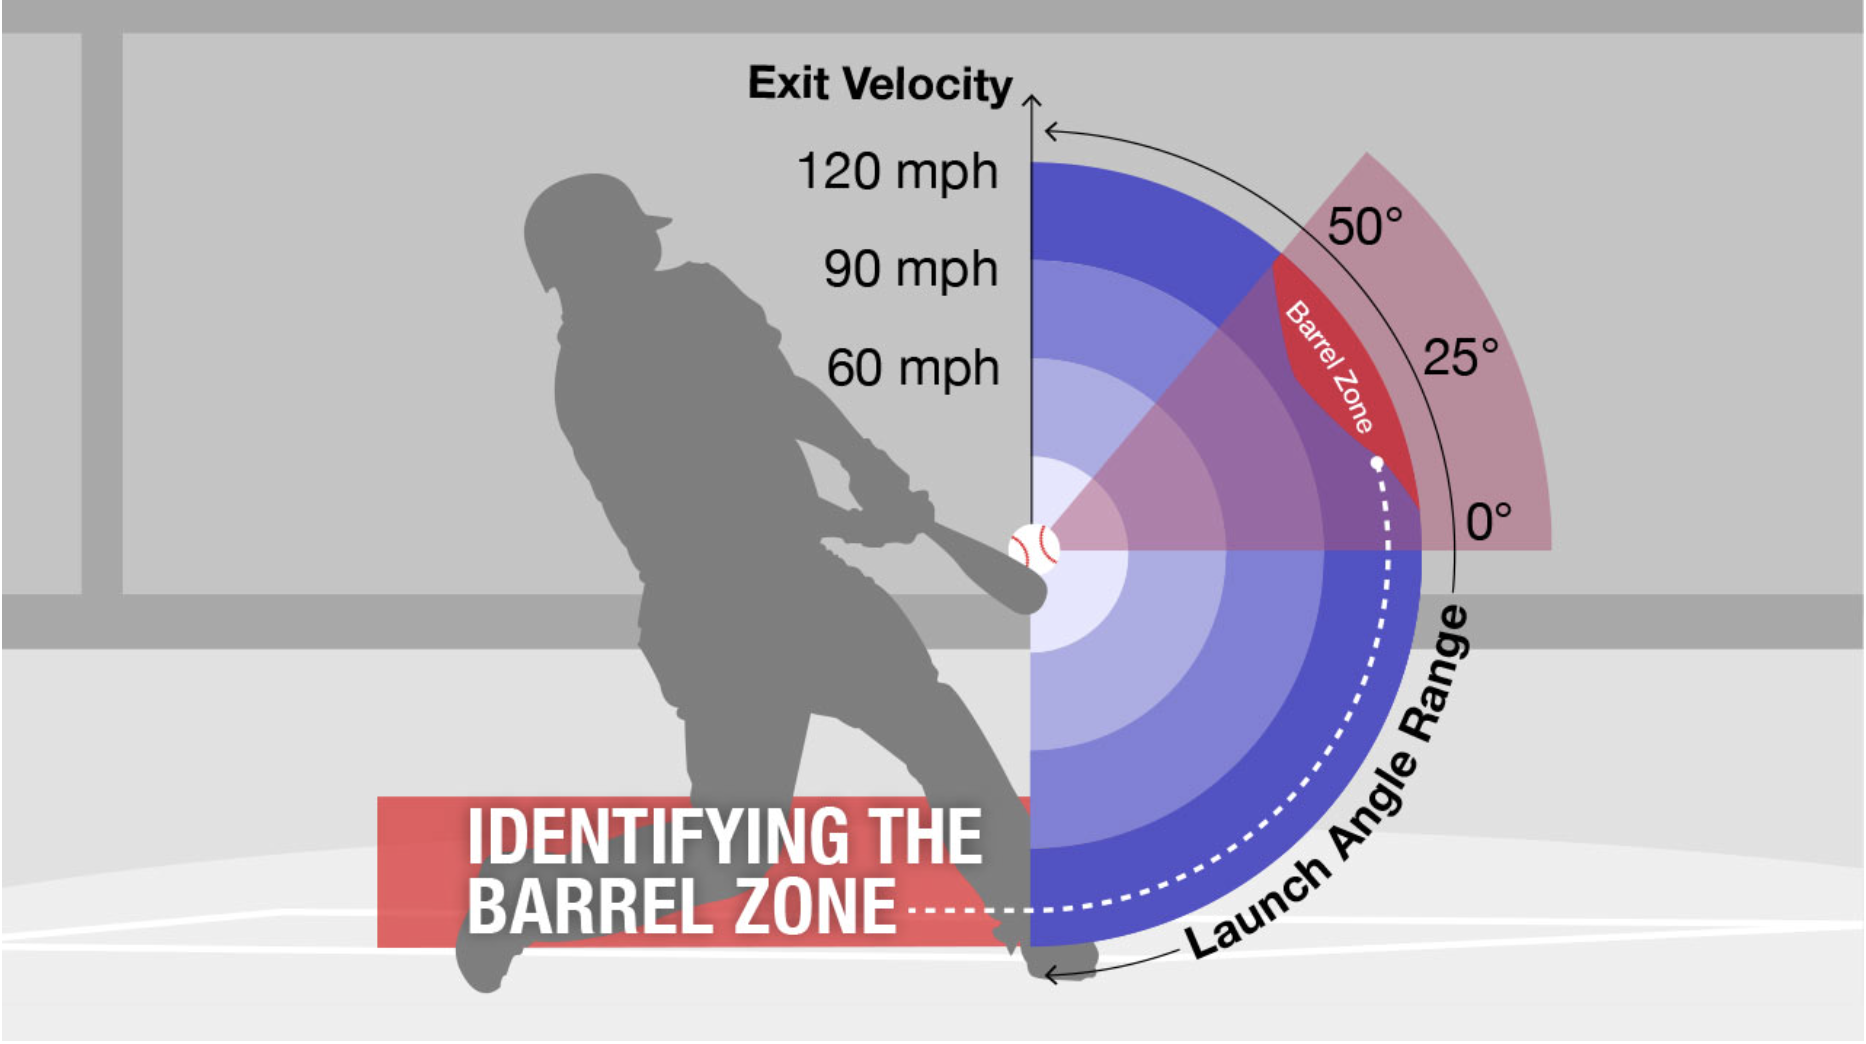
It’s wild to think that the Statcast data could be free because football advanced metrics tend to land behind a paywall. We can find plate discipline metrics in the Statcast data, though we typically focus on the barrel rates, hard hit metrics and the new bat-tracking data. Launch angles can be seen via groundball, line drive and flyball rates. A hitter’s launch angle between 10-25 degrees can be categorized as a line drive. Groundballs have launch angles below 10 degrees, with flyballs between 25 and 50 degrees.
It’s nice when a hitter hits the ball hard (over 95 mph), but the launch angles also matter. An example would be a hitter who hits the ball hard, but flashes a heavy groundball approach, likely leading to lower barrel rates. If a hitter often hits groundballs, we want them to destroy balls when they elevate them via line drives and flyballs. To define barrels, a hitter must hit the ball at an exit velocity of 98 mph or higher with a launch angle between 25 to 30 degrees. Barrels per plate appearance correlates well to home runs (0.550), so hitters who barrel up the ball tend to generate more power and home runs.
When we pair the plate discipline, we can find potential breakouts or fades because they either struggle or thrive in plate discipline and hard-hit metrics. It’s a high-risk, high-reward profile for a hitter if they hit the ball hard while struggling to make contact. Two other exit velocity metrics to consider on Statcast include Exit Velocity 50 or EV50 and average exit velocity on flyballs and line drives (EV on FB/LD). EV50 is defined as the average of the highest 50% of the hitter’s batted balls, potentially giving us a more reliable metric than average exit velocity.
If we have hitters who tend to have lower launch angles, we want them to crush batted balls on flyballs and line drives. We know that groundballs tend to be at a lower average exit velocity, so we can find optimism for hitters like Christian Yelich, Yandy Diaz, Brett Baty, James Wood, William Contreras and Bryan Reynolds, who have low launch angles (high groundball rates) while hitting the ball hard in the air when they elevate it.
The visual below shows hitters with the lowest launch angles in 2025, with at least 100 batted-ball events.
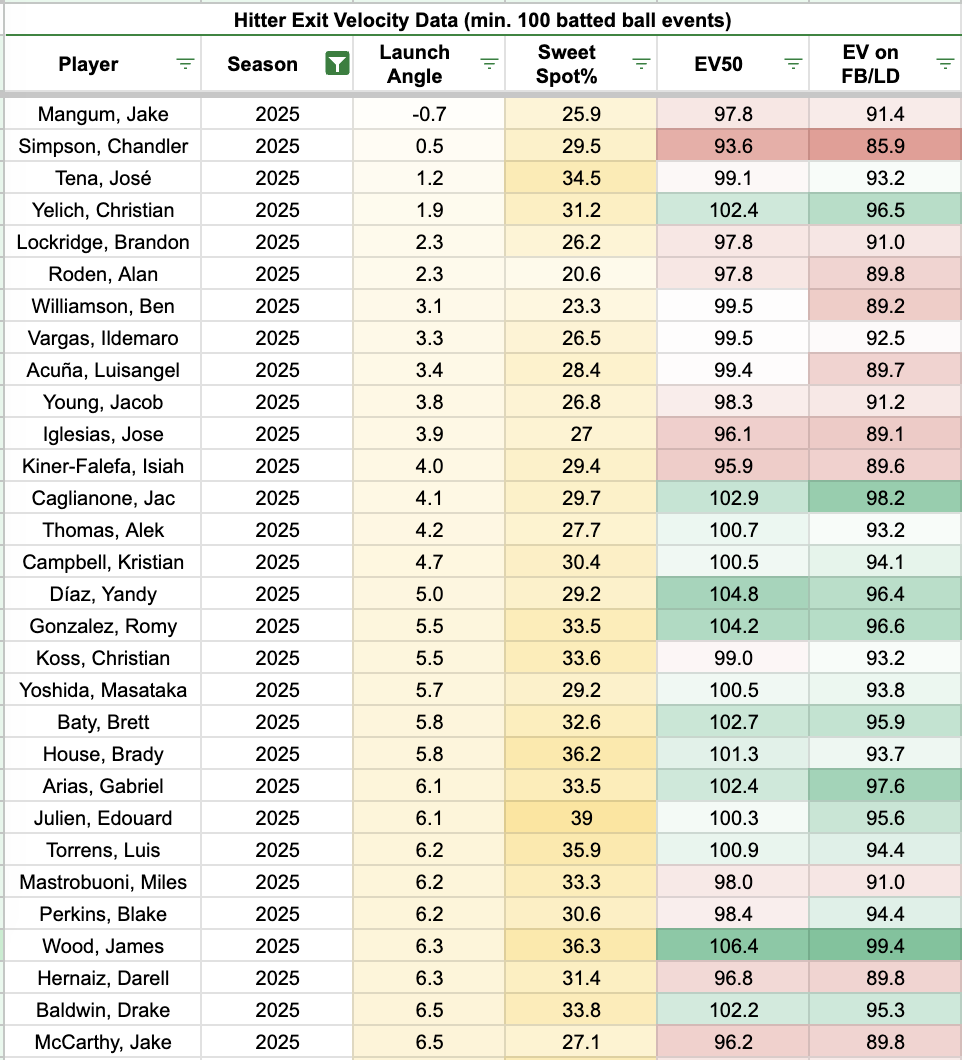
This goes back to our discussion about how context matters, and one advanced stat shouldn’t be the endpoint. Optimal launch angles, high-end exit velocities and launch angle consistency tend to lead to fruitful outcomes.
Control and Whiffs for Pitchers
Strikeout minus walk rate (K-BB%) has long been one of the more proven metrics for a pitcher’s skill. What if we could add a layer to that? One way involves looking at balls and swinging strikes. Swinging-strike rate is calculated by swings and misses divided by total pitches thrown. Meanwhile, whiff rate on Statcast is the percentage of swings-and-misses divided by swings.
Each pitch has a different threshold for average, above-average and near-elite from a swinging-strike or whiff rate. I prefer to use the swinging-strike rate because it aligns with the ball rate and the overall swinging-strike rate. The top-three notable pitches with a league-average swinging-strike rate at 15% or higher include sliders (16.1%), splitters (17.7%), and changeups (15.6%). Meanwhile, sweepers (14.3%) and curveballs (13.5%) were close behind, but typically not massive bat-missers based on the league norm.
Alex Chamberlain’s pitch leaderboards give us the league averages by pitch from a plate discipline standpoint, as seen below.
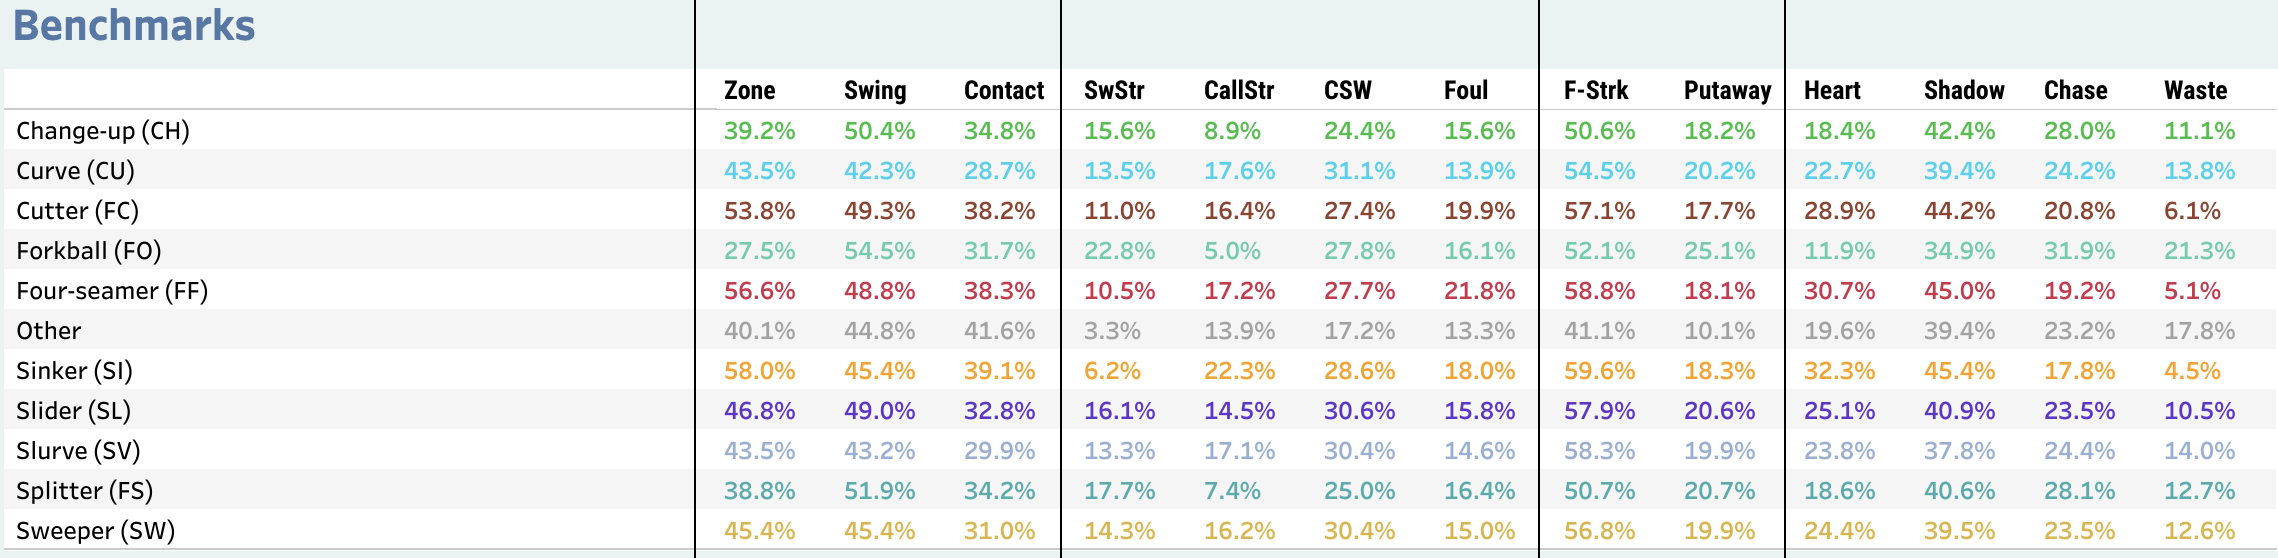
Among fastballs, the league-average four-seamers elicited a 10.5% swinging-strike rate, with cutters at 11%. Unsurprisingly, sinkers generated a 6.2% swinging-strike rate, which is not a top priority for swinging strikes and whiffs. The league average swinging-strike rates typically fluctuate around half a percentage point from year to year.
One final piece to consider with the swinging-strike rate involves the sample. If a pitch generates 10 swings and misses (whiffs) out of 30 pitches thrown, we want to be cautious with that pitch type continuing to elicit a 33.3% swinging-strike rate. So if there’s a lowly used pitch, there will be some volatility, though that’s where the pitch characteristics, movement profiles and locations matter.
Generally, pitchers with poor control tend to find themselves as relievers. If a starting pitcher struggles with control, then we want them to have high strikeout skills, or it’s a risky profile. Examples of starting pitchers with a risky profile include Luis Gil, Spencer Arrighetti, Charlie Morton and Lucas Giolito from last season.
To find pitchers who can elicit swings and misses, here’s a look at the eight starting pitchers with two pitches that generated a swinging-strike rate at 20% or higher in 2025 with at least 50 pitches thrown: Kyle Bradish (curveball, slider), MacKenzie Gore (cutter, changeup, slider), Cade Horton (changeup, sweeper), Shohei Ohtani (slider, sweeper), Reese Olson (changeup, slider), Cole Ragans (changeup, slider) and Blake Snell (changeup, slider). These are the kinds of high-strikeout and high-upside starting pitchers we want to target, assuming we don’t have significant injury risks.
Pitch Movement Profiles
Many like to cite the “stuff” metrics like Stuff+ and other similar stuff models. However, I like to dig into the inputs that go into the stuff metrics. Examples of Stuff model inputs include pitch movement profiles (horizontal and vertical), release points and more. That said, often we can examine the individual pitch movement profiles and figure out which pitch moves horizontally or vertically more than the average of that pitch type.
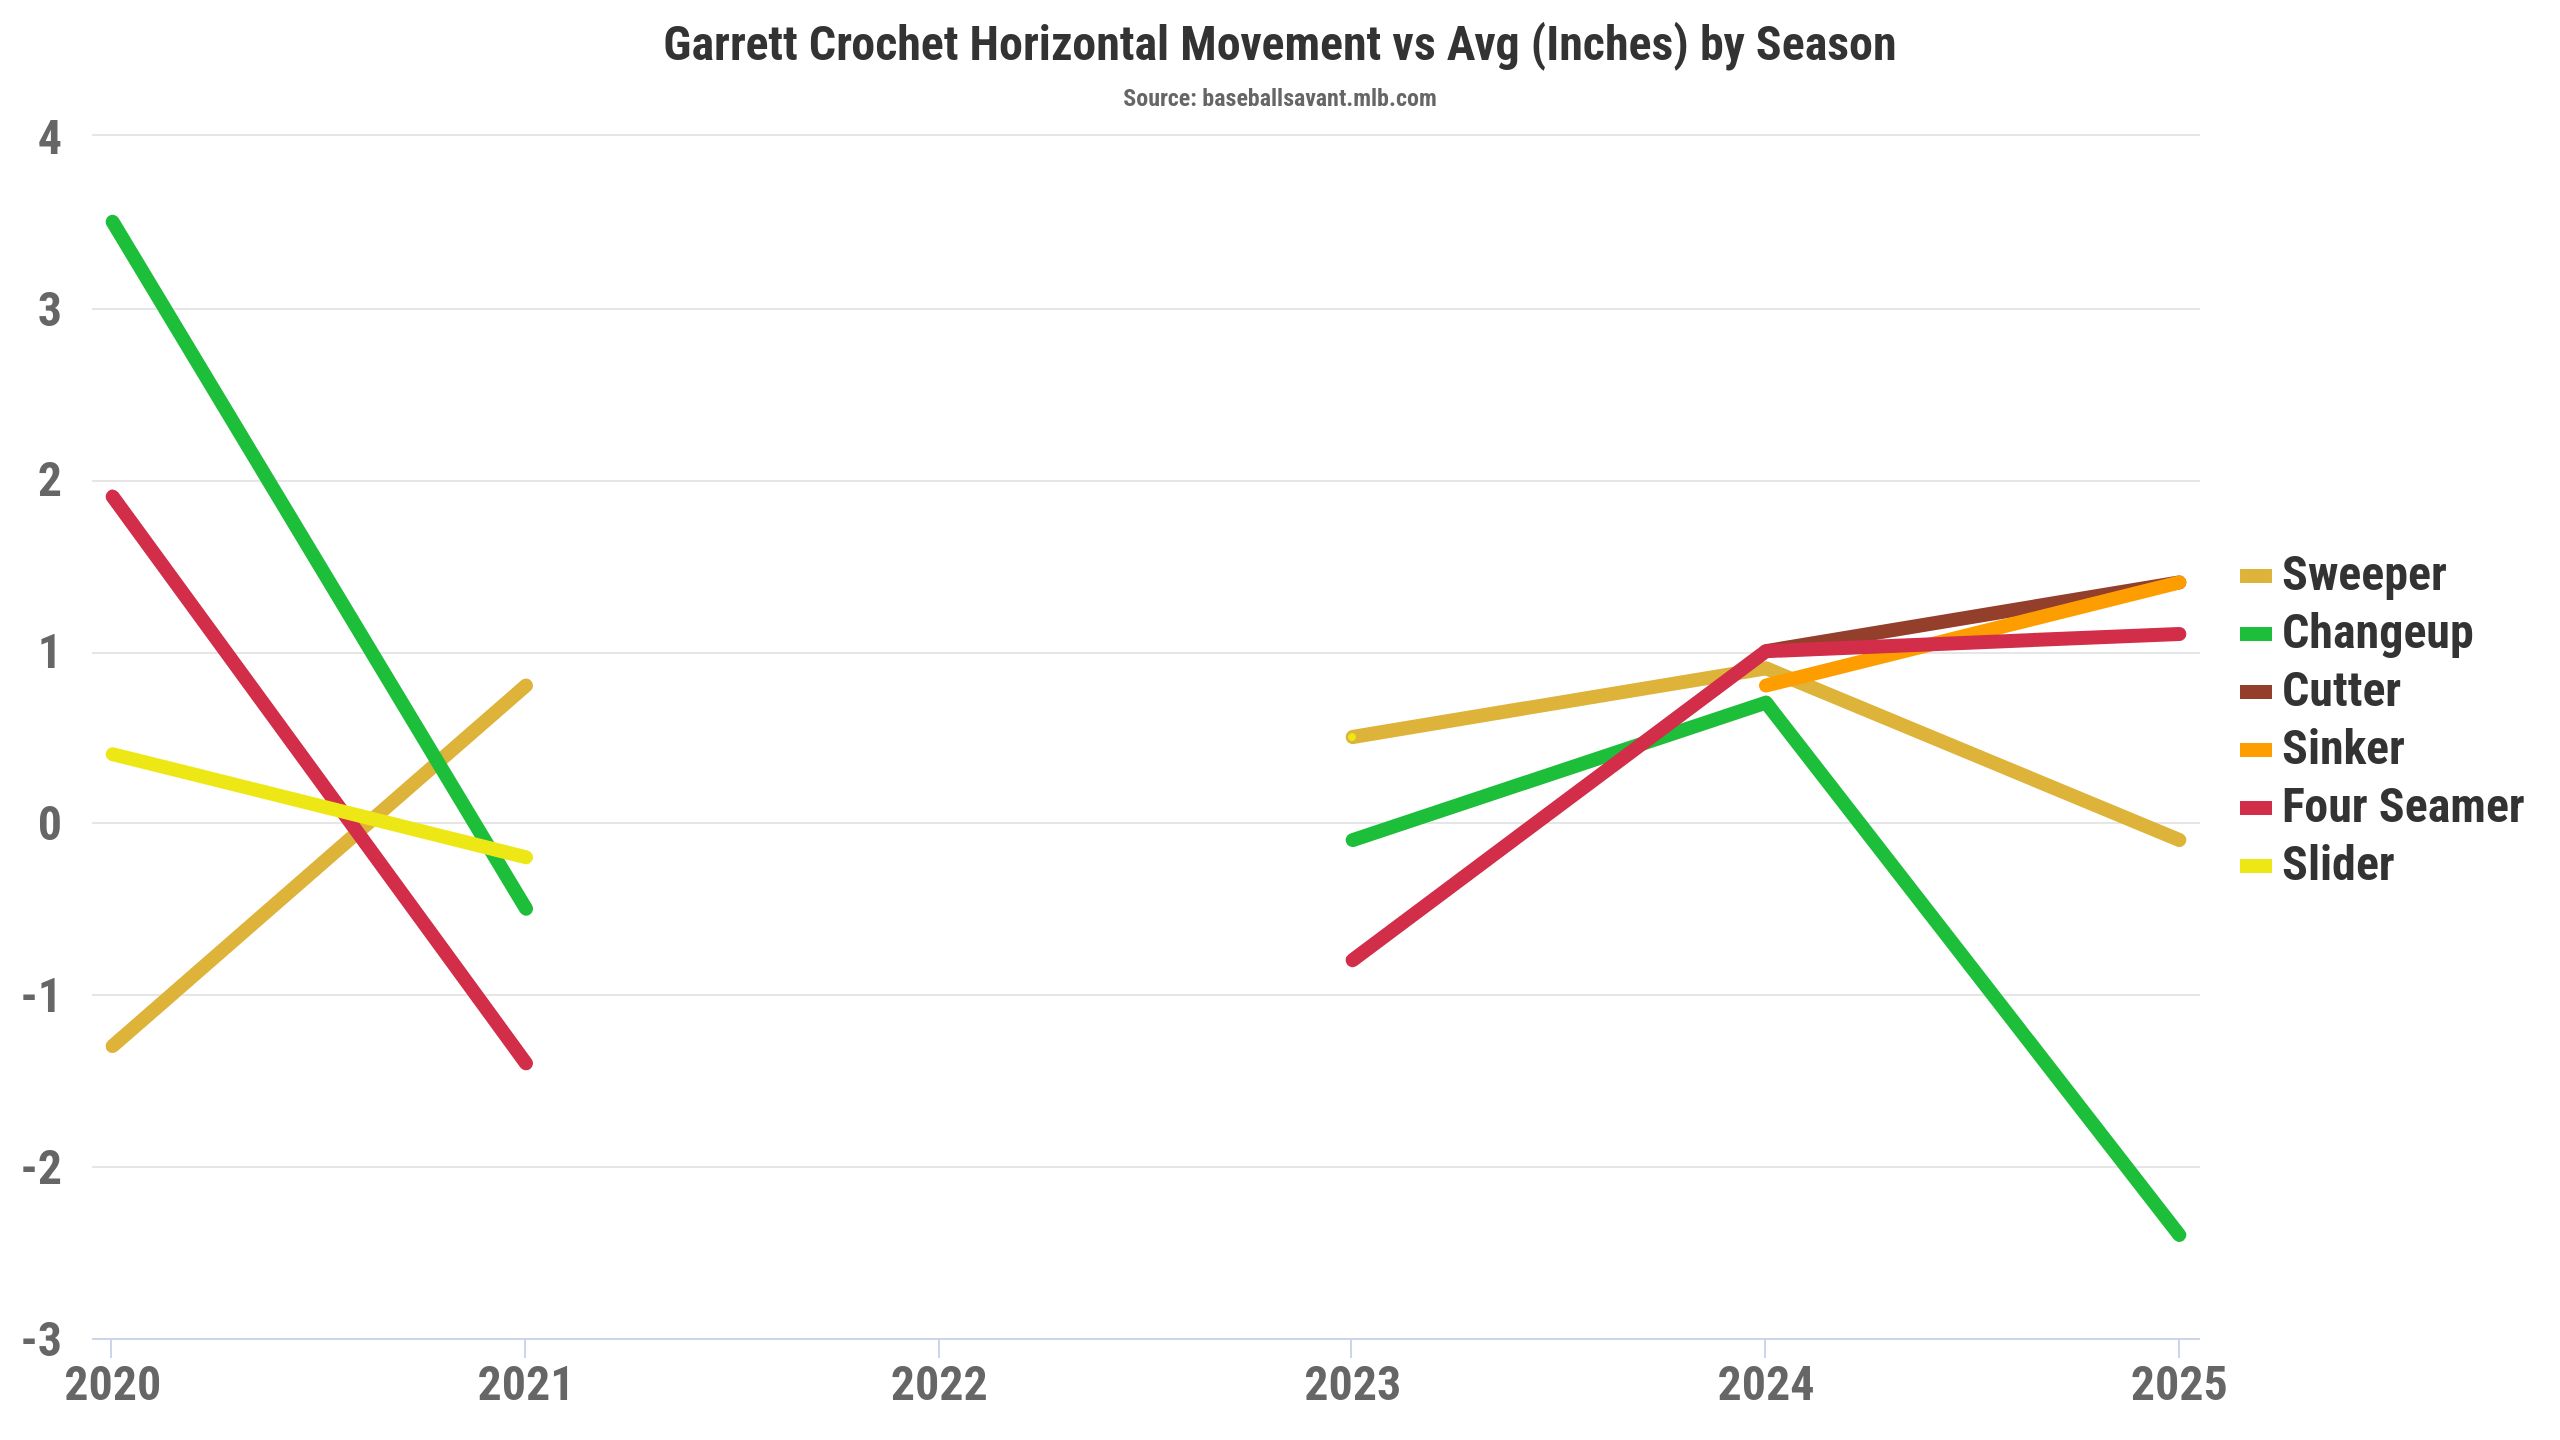
However, it’s worth noting that pitches with tons of horizontal or vertical movement profiles don’t automatically mean they grade highly in Stuff models. Furthermore, we’ll highlight that pitches that tend to have more vertical movement typically generate more whiffs. On the flip side, typically pitches with more horizontal movement can lead to weaker contact. If a pitch possesses tons of downward movement compared to an average one, we might guess it should elicit more whiffs and weak contact. If that’s not the case, and the pitch gives up hard contact with fewer whiffs, we can speculate on poor locations for that given pitch.
For four-seamers, we want to look for pitchers with high amounts of induced vertical break (IVB), like Nick Pivetta, Tobias Myers, Nestor Cortes Jr., Ryne Nelson and Ryan Pepiot. If it’s a slider, changeup or splitter, we want to focus on pitchers who generate tons of downward movement like Chris Sale’s slider, Garrett Whitlock’s slider, Logan Webb’s changeup or Cristopher Sánchez’s changeup.
Pitcher Release Points and Arm Angles
Statcast recently introduced arm angle over the past few seasons, giving us a window into different arm slots for pitchers. Similar to the conversation around Stuff models and the individual pitch movement profiles, the vertical and horizontal release points can help us at a more granular level to find any inputs that could be impacting a pitcher’s command, pitch locations and movement profiles. For instance, if a pitcher’s horizontal release point moves farther away from the midline of their body, we could expect possibly more horizontal movement, unless this horizontal release adjustment coincides with a vertical release change.
The visual below shows George Kirby’s career arm angles by season for reference:
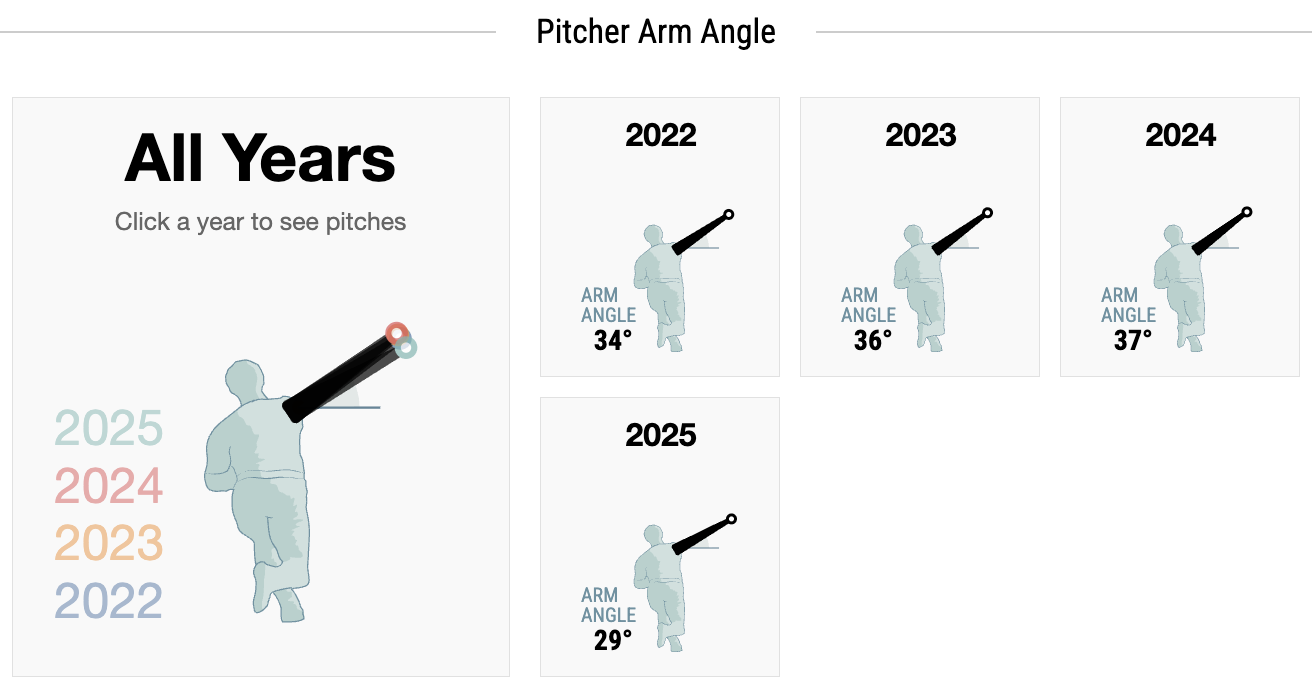
Additionally, if a pitcher uses a higher arm angle, we might not find as much horizontal pitch movement, though there will be outliers. Where the pitcher release points matter typically become highlighted after a pitcher’s control improved or regressed, with fewer or more whiffs, and the batted-ball results on a certain pitch were better or worse. That type of analysis will be found in my regular work, as we tend to dive into the weeds to uncover additional advanced stats to guide the player-level analysis.
ERA Estimators
There were articles written about Fielding Independent Pitching (FIP) and Expected FIP (xFIP) in 2010. I’d like to think we’ve come relatively far over 15 years later in the advanced stats and ERA estimators. FIP looks at strikeouts, walks, hit by pitches and home runs allowed. We already discussed how there’s more nuance in examining pitchers from a starting pitcher standpoint. Meanwhile, xFIP takes FIP a step further to account for a league average in home run per flyball rate. The tricky part with scaling to league averages involves players having their own norms based on their skill set and advanced metrics.
Another common ERA estimator is Skill-Interactive Earned Run Average or SIERA, which adjusts for balls in play instead of eliminating those factors like FIP or xFIP. Research from 2011 showed that SIERA can be more predictive than FIP or xFIP, as it considers balls in play like groundballs, line drives, flyballs and pop-ups. At this point, we have exit velocity data, among other baseball advanced stats available, so why not discuss Expected ERA or xERA?
According to Statcast, xERA is the pitcher’s version of Expected Weighted On-Base Average (xwOBA). xERA and xwOBA account for strikeouts, walks, hit by pitches, exit velocities and launch angles, crediting and suggesting that pitchers and hitters can impact balls in play. Statcast notes that xERA isn’t predictive, but an indicator that a pitcher may be able to suppress contact quality. I find the process of examining a pitcher’s skills before looking at the ERA estimators helps to support or wonder whether the player can sustain their success or if regression might hit. It’s the theme of examining the inputs that affect the outputs and expected metrics.
Some of the best pitchers have the better ERA estimators, including Shohei Ohtani, Chris Sale, Garrett Crochet, Bryan Woo, Kyle Bradish, Emmet Sheehan and Paul Skenes. Since the strikeout skill metrics correlate well to those ERA estimators, we can guess they’re likely legitimate starting pitchers.
Bat Tracking Metrics
The days of only citing hard-hit metrics have passed, as now we have bat-track metrics, including bat speed and fast-swing rate. Bat speed correlates well with hard-hit percentage (0.554) and barrels per plate appearance rate (0.464). The correlation between bat speed and home runs was 0.328. Meanwhile, bat speed doesn’t correlate well with batting average (0.083) and expected batting average (0.014), though it does correlate with expected slugging percentage (0.355).
That tells us that bat speed should translate into barrel rate and hard-hit metrics, which theoretically makes sense. Hitters who swing the bat fast tend to hit the ball hard, assuming they make enough contact and swing fast while hitting the ball. A hitter’s bat tracking profile would be more volatile if they swing fast with a high bat speed and struggle to make contact. Some hitters who fit that profile include Jhonkensy Noel, Colson Montgomery, Matt Wallner, Alexander Canario, and Christopher Morel.
The visual below shows the hitters sorted by the top 30 in bat speed, with other bat tracking metrics included.
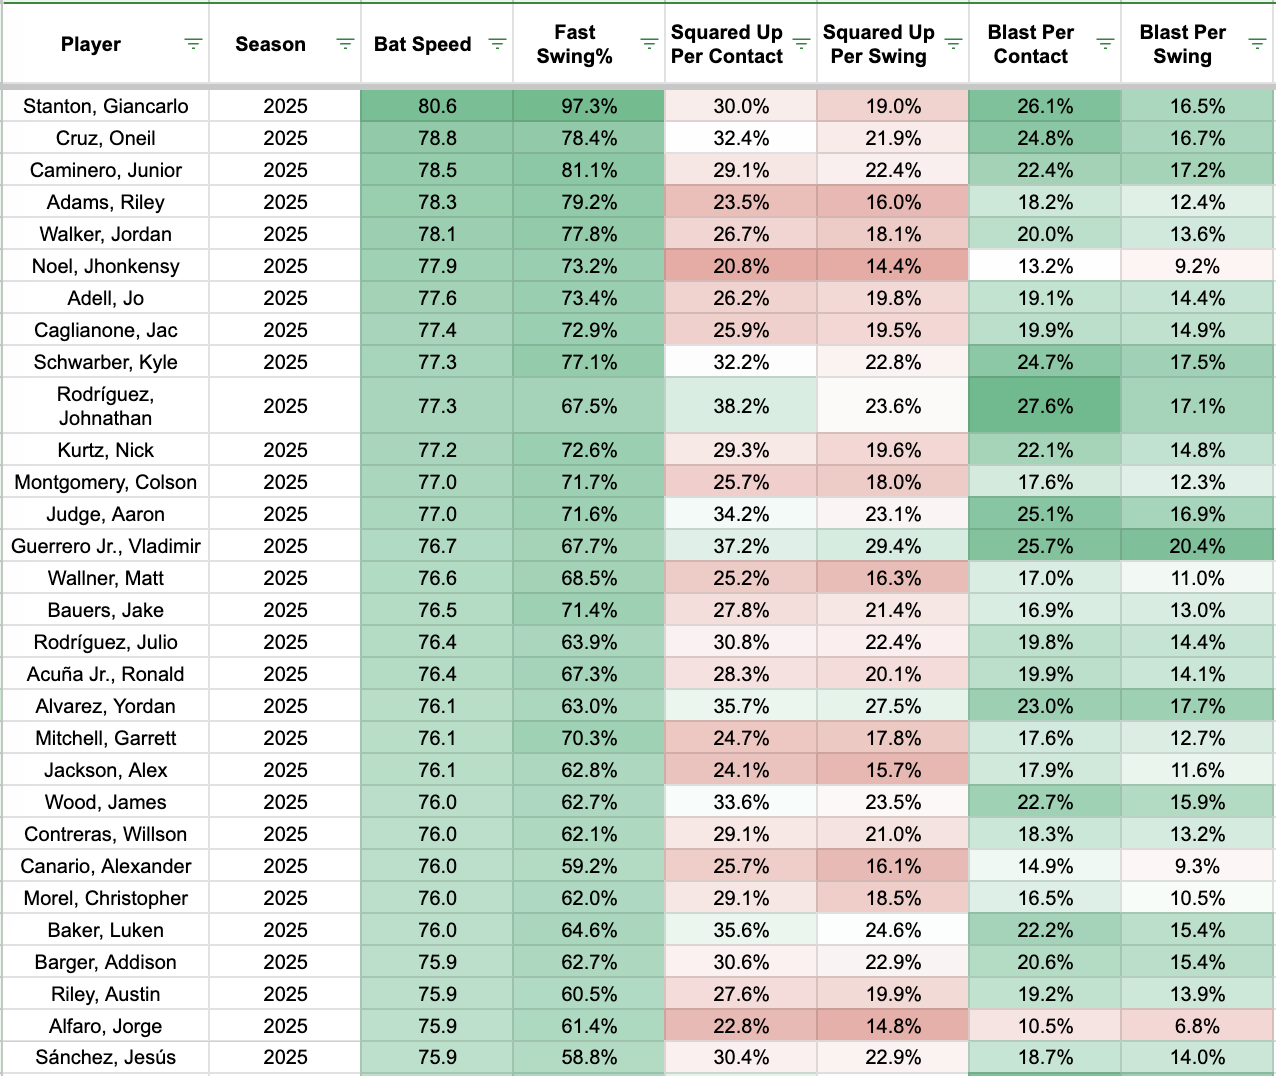
Another notable bat tracking metric to monitor involves fast swing rate, which accounts for the percentage of swings at 75 mph or higher. That’s not an arbitrary cutoff, but an important one at 75 mph since the league average bat speed hovers around 72 mph. Hitters with a high percentage of fast swing rates have a mixture of elite power hitters and some noisy names. Those elite power hitters with high fast swing rates include Giancarlo Stanton, Oneil Cruz, Kyle Schwarber, Nick Kurtz, Aaron Judge and Vladimir Guerrero Jr.
Finally, let’s define squared up and blasts under the bat tracking category. Statcast defines squared up balls as coming from a swing that attains at least 80% of the maximum possible exit velocity. You might be wondering how they define or estimate the maximum exit velocity on a swing; it includes bat speed and pitch velocity.
This is where the advanced stats become hairy because Statcast mentions that squared-up balls typically come from the sweet spot of the bat (about 4-9 inches from the head of the bat). That’s notable because Statcast also has a sweet spot percentage, which includes the percentage of batted balls hit in the sweet spot of the bat.
Furthermore, when there’s a squared-up ball with high bat speed, it becomes a blast, which tends to lead to optimal results. A high bat speed goes beyond a fast swing rate. Statcast references an 82 mph bat speed as a threshold to create a blast, assuming the hitter squared up the ball. If these bat tracking metrics make our heads spin, focus on bat speed and fast swing rate, since those translate well into the other power skill metrics like barrels and hard-hit percentage. These bat tracking metrics help us to dive deeper into the nuances of real-life and fantasy baseball.